
How to Analyse Stocks in India – Fundamental vs Technical Analysis Explained
4/1/20252 min read
How to Analyse Stocks: Fundamental vs Technical Analysis Explained
Making informed investment decisions in the stock market requires more than just reacting to price trends. Smart investors use structured analysis methods to evaluate potential opportunities. The two primary approaches are Fundamental Analysis and Technical Analysis. Understanding both helps investors build effective strategies suited to their financial goals.
This blog breaks down the differences, applications, and use-cases of each method to help you decide which approach—or combination—is right for you.
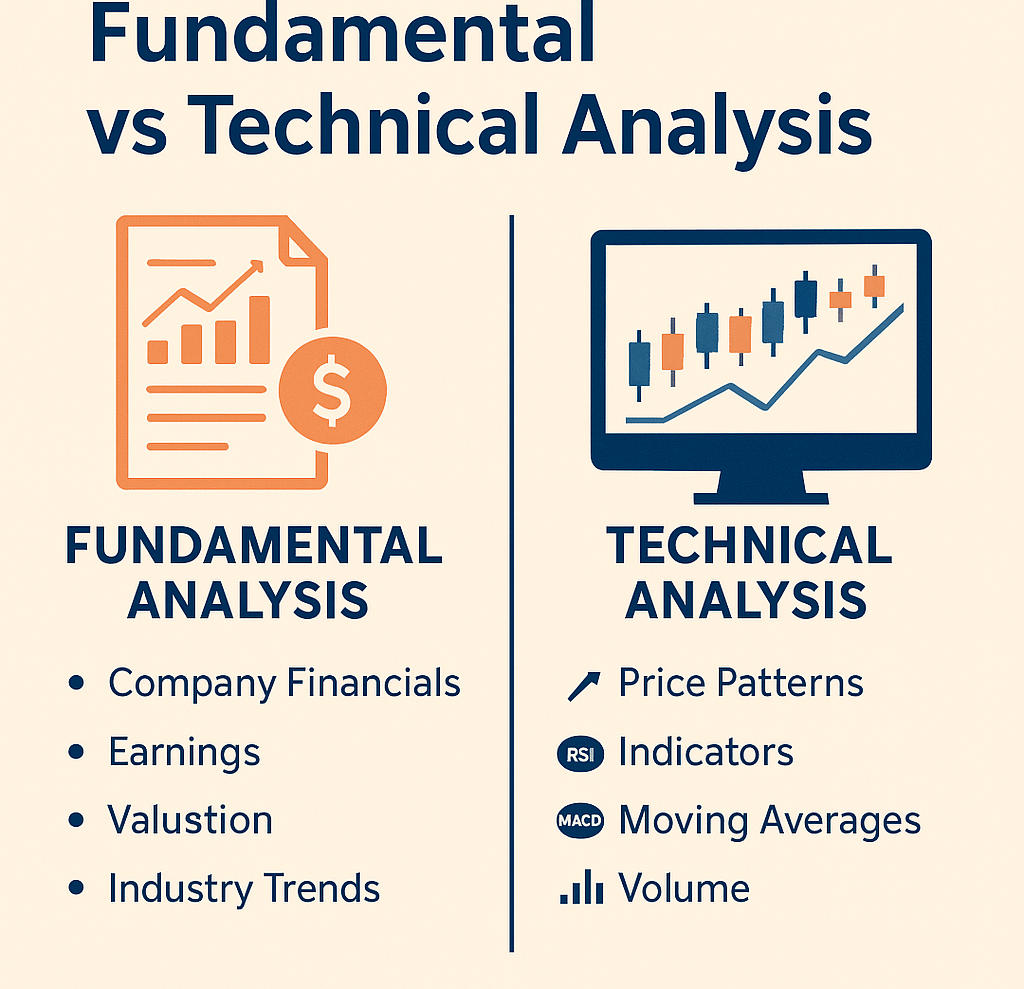
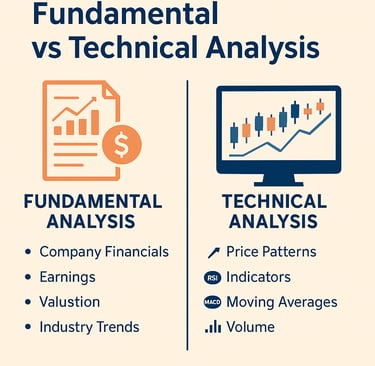
What is Fundamental Analysis?
Fundamental analysis is the process of evaluating a stock by examining the underlying financial health, performance metrics, and economic conditions of a company. It focuses on the intrinsic value of a stock, aiming to determine whether it is overvalued or undervalued relative to its current market price.
Key Components of Fundamental Analysis:
• Earnings Per Share (EPS)
• Price-to-Earnings (P/E) Ratio
• Debt-to-Equity Ratio
• Return on Equity (ROE)
• Revenue and Profit Growth
• Industry Trends & Competitive Advantage (Moat)
• Macroeconomic Conditions
Who Should Use It?
• Long-term investors
• Value investors
• Mutual fund and SIP investors
• Those looking for wealth creation over years
Example:
If you’re considering investing in Infosys, fundamental analysis would involve studying its quarterly results, balance sheet strength, market share in the IT sector, and future earnings potential.
What is Technical Analysis?
Technical analysis involves studying historical price movements and trading volumes using charts and indicators to forecast future price behavior. It focuses on market sentiment, trend patterns, and momentum, rather than business fundamentals.
Key Tools in Technical Analysis:
• Candlestick Patterns
• Moving Averages (SMA, EMA)
• Relative Strength Index (RSI)
• MACD (Moving Average Convergence Divergence)
• Bollinger Bands
• Volume Analysis and Support/Resistance Zones
Who Should Use It?
• Short-term traders
• Intraday and swing traders
• F&O participants
• Those actively managing trades on a daily or weekly basis
Example:
A trader using technical analysis to time entry into Reliance Industries may look for breakout patterns or momentum signals using indicators like RSI or MACD.
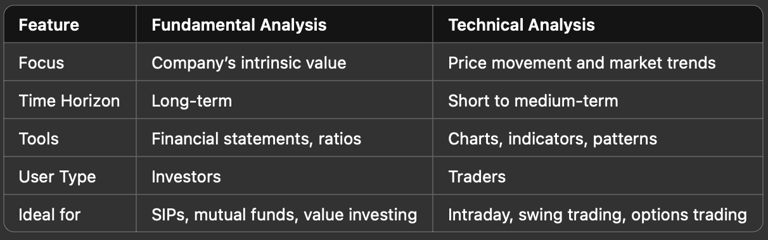
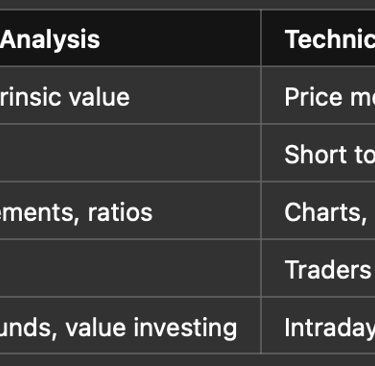
Fundamental vs Technical Analysis – What’s the Difference?
Which Approach Is Better?
Both analysis types serve different purposes.
• If your goal is to build long-term wealth, fundamental analysis should form the backbone of your strategy.
• If you’re actively trading and responding to market momentum, technical analysis helps fine-tune your entries and exits.
At One Solution, we empower investors and traders with access to both types of tools—fundamental screeners, research reports, technical charts, live data, and personalized advisory—to help you invest smarter.
Final Thoughts
There’s no one-size-fits-all strategy in the stock market. Successful investing is about combining insight with discipline. Whether you’re building a multi-year equity portfolio or executing short-term trades, knowing when to apply fundamental or technical analysis can significantly improve your decision-making.
Ready to get started? Open your free Demat and trading account with One Solution today and explore intelligent investing backed by research and analytics.
About One Solution
Quick Links
Contact Info
One Solution — Your trusted partner for financial success.
📍 F17, Grand Plaza, Paltan Bazar
Guwahati, Kamrup (M), Assam
India, Pin: 781008
📞 9650072280
© 2025 One Solution. All Rights Reserved.