How to Read Stock Charts India – Beginner’s Guide to Technical Analysis
4/1/20252 min read
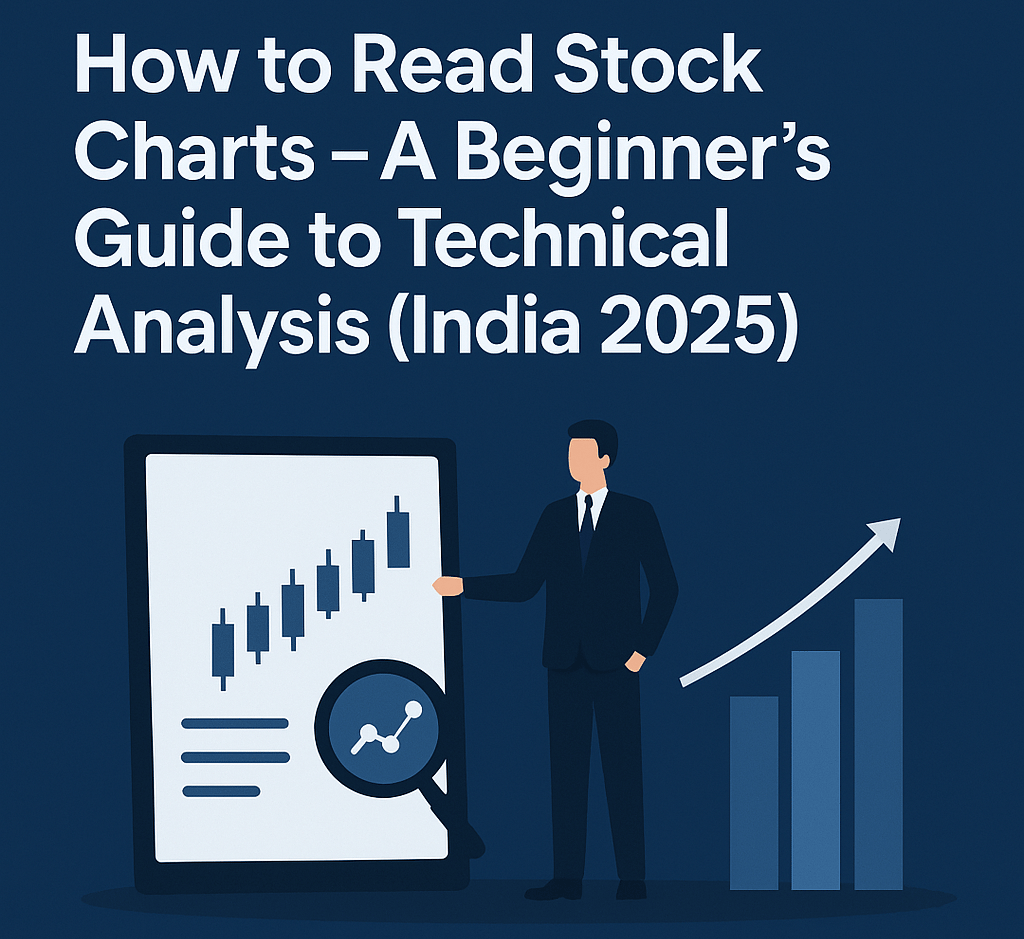
How to Read Stock Charts – A Beginner’s Guide to Technical Analysis (India 2025)
Stock charts may look overwhelming at first, but they are powerful tools that help investors and traders understand price movements, trends, and entry/exit points. Whether you’re investing in long-term blue-chip stocks or actively trading intraday, learning how to read charts is essential to making informed decisions.
In this beginner-friendly guide, we explain the basics of reading stock charts using Indian platforms, covering candlestick patterns, indicators, and how to use them effectively for analysis.
What Is a Stock Chart?
A stock chart is a graphical representation of a stock’s price movement over a period of time. It displays:
• Price data (Open, High, Low, Close)
• Volume traded
• Time period (1 minute, daily, weekly, etc.)
Stock charts can be used to:
• Identify trends
• Predict future price movements
• Analyze momentum and volatility
• Confirm support and resistance levels
Most Indian trading platforms like One Solution, Angel One, or TradingView integrate advanced charting tools.
Types of Stock Charts
1. Line Chart
• Simplest form showing closing prices over time
• Good for visualizing overall trend
2. Bar Chart
• Displays open, high, low, close prices (OHLC)
• Preferred by traditional traders
3. Candlestick Chart (Most Popular)
• Visualizes price movement within each time frame
• Helps identify bullish and bearish patterns easily
Understanding Candlestick Patterns
Each candle shows four price points: Open, High, Low, Close.
• Green Candle: Price closed higher than it opened (bullish)
• Red Candle: Price closed lower than it opened (bearish)
Common patterns include:
• Doji: Indicates indecision
• Hammer: Reversal signal after a downtrend
• Engulfing Pattern: Strong reversal indicator
• Morning Star / Evening Star: Predict bullish/bearish reversals
Learning these patterns helps traders anticipate market behavior.
Key Indicators to Read Charts Effectively
🔹 Moving Averages (SMA/EMA)
• Smooths out price action and shows trend direction
• Crossovers (e.g., 50-day vs 200-day) indicate potential trend reversals
🔹 RSI (Relative Strength Index)
• Momentum indicator showing overbought or oversold conditions
• RSI > 70 = Overbought | RSI < 30 = Oversold
🔹 MACD (Moving Average Convergence Divergence)
• Detects changes in trend direction and momentum
• MACD line crossing signal line triggers buy/sell signals
🔹 Volume
• High volume confirms strong price movement
• Helps detect breakouts and fakeouts
How to Use Charts for Entry & Exit
• Use support and resistance zones to determine when to enter or exit
• Combine candlestick patterns with indicators for confirmation
• Avoid trading solely on one indicator—build a strategy that includes multiple tool
With One Solution, you get access to charting tools with preloaded indicators, drawing features, and real-time market data for NSE, BSE, and MCX.
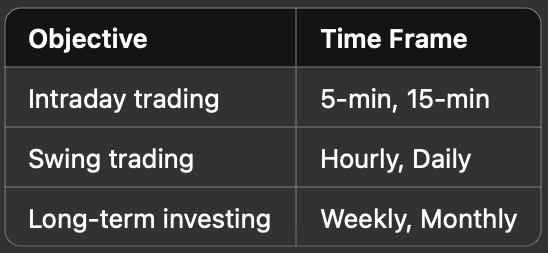
Best Time Frame for Chart Analysis
Choose your chart timeframe based on your investment horizon and trading strategy.
Interlink With Related Blogs:
• Fundamental vs Technical Analysis – What to Use When
• Common Stock Market Mistakes Beginners Make
• Best Time to Invest in Stock Market
Final Thoughts
Learning how to read stock charts transforms you from a reactive investor to a strategic one. Whether you’re analyzing a potential breakout or evaluating a price trend, charts offer the clarity and confidence needed to act wisely.
With One Solution, you get free access to trading tools, smart advisory, and advanced charts tailored for Indian investors. Start decoding the markets today.
About One Solution
Quick Links
Contact Info
One Solution — Your trusted partner for financial success.
📍 F17, Grand Plaza, Paltan Bazar
Guwahati, Kamrup (M), Assam
India, Pin: 781008
📞 9650072280
© 2025 One Solution. All Rights Reserved.